
The tape is still an uptrend, it just stopped sprinting.
On Thursday, October 8, 2026, the S&P 500 closed at 7,765.36, down 0.47% on the day and about 1% off the October 6 intraday high at 7,844.52. That high cleared the prior August ceiling. Two sessions later the index is digesting it, not breaking it. Year-to-date the index is still up roughly 13%.
Daily chart, plain English:
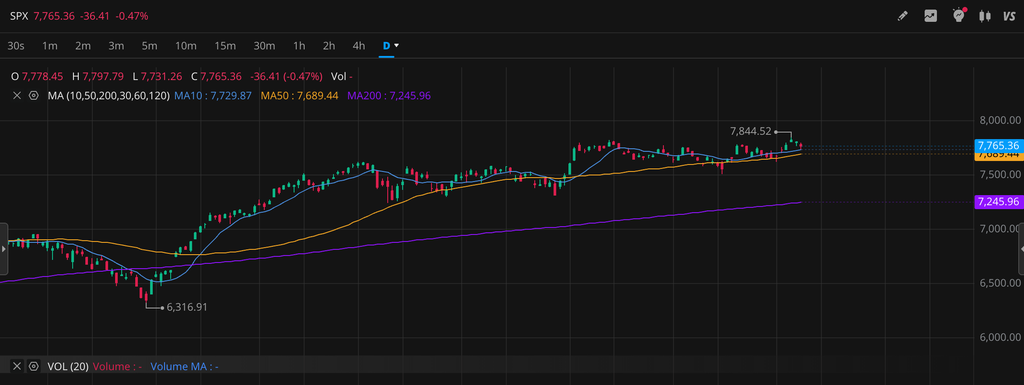
Price is above the 20-day (~7,697), the 50-day (~7,689), and the 200-day (~7,246). The 50-day remains above the 200-day, so the longer-term golden-cross structure is intact. RSI(14) sits in the mid-50s — not overbought, not washed out. MACD is still positive. Daily swing structure stays higher-highs / higher-lows until the October 1 low near 7,617 gives way.
Levels that matter from here:
- Overhead: 7,800 (round number and recent congestion), then the 7,844.52 high. A clean daily close back through that high reopens the upside.
- First support: the 7,730–7,704 zone, which is the 50–61.8% retrace of the bounce off the October 1 low. That area also lines up near the rising 20-day.
- Next shelf: the 50-day around 7,689, then the October 1 swing low at 7,617. A daily close under 7,617 would be the first real change in the intermediate trend.
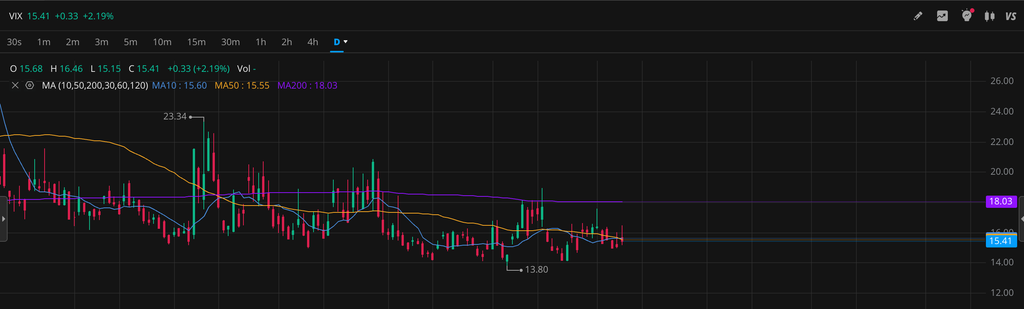
Volatility is quiet. VIX has been hanging in the mid-teens. Quiet is fine until it isn’t — especially with oil and yields both elevated.
The macro tape under the chartThe pullback is not coming from a broken chart. It is coming from the stuff the chart has been ignoring. The 10-year Treasury yield has been trading in the mid-5% area, briefly tagging about 5.36% this week — levels not seen since the early 2000s. Brent has been whipping around the $100–$104 zone on Middle East shipping stress. Higher energy plus higher real yields is the classic “inflation isn’t done” mix, and it is landing right as Q3 earnings season gets underway (big banks this week and next).
Fed funds are currently 3.75–4.00% after the September hike. The next two meetings decide whether that was a one-off or the start of a higher-for-longer reprice. That is the setup the daily chart is trading against.Big economic events, mid-October through year-endTimes are Eastern. These are the prints and meetings that actually move the index.
October:
- Oct 9 — University of Michigan consumer sentiment (preliminary), 10:00 a.m.
- Oct 14 — CPI (September), 8:30 a.m. First real inflation test after the oil spike.
- Oct 15 — PPI and retail sales (September), 8:30 a.m.
- Oct 27–28 — FOMC meeting. Rate decision and statement Wednesday, Oct 28 at 2:00 p.m., press conference 2:30 p.m. No dot plot.
- Oct 29 — Q3 GDP advance estimate and September PCE / personal income & outlays, both 8:30 a.m. Growth and the Fed’s preferred inflation gauge on the same morning.
November:
- Nov 3 — U.S. midterm elections. Control of the House and Senate is the policy variable. Historically the market often firms in the weeks around the vote once the outcome is clearer; sector leadership still depends on who wins what.
- Nov 3 — JOLTS (September), 10:00 a.m.
- Nov 6 — Employment situation / nonfarm payrolls (October), 8:30 a.m.
- Nov 10 — CPI (October), 8:30 a.m.
- Nov 13 — PPI (October), 8:30 a.m.
- Nov 17 — Retail sales (October), 8:30 a.m.
- Nov 18 — FOMC minutes from the October meeting, 2:00 p.m.
- Nov 25 — Q3 GDP second estimate and October PCE, 8:30 a.m.
- Nov 26 — Thanksgiving, markets closed. Nov 27 early close.
December:
- Dec 1 — JOLTS (October), 10:00 a.m.
- Dec 4 — Employment situation / nonfarm payrolls (November), 8:30 a.m.
- Dec 8–9 — FOMC meeting with Summary of Economic Projections and the dot plot. Decision Wednesday, Dec 9 at 2:00 p.m., press conference 2:30 p.m. This is the last scheduled policy event of the year and the one that resets 2027 rate expectations.
- Dec 10 — CPI (November), 8:30 a.m. Awkwardly the day after the Fed.
- Dec 15 — PPI (November).
- Dec 16 — Retail sales (November).
- Dec 23 — Q3 GDP third estimate and November PCE, 8:30 a.m.
- Dec 24 — early close. Dec 25 — markets closed.
How to use it:
The daily chart says buy-the-dip as long as 7,617 holds and the 50-day keeps rising underneath. The calendar says the next real tests are September CPI on the 14th, the October FOMC on the 28th, the midterms on November 3, and the December meeting with the dots. Oil and the 10-year are the wild cards in between — if either keeps ripping, the “soft pullback inside an uptrend” story gets harder to defend even if the moving averages are still stacked bullishly.
Not advice. Just the chart and the dates.