From a purely chartist perspective and trying to make sense of everything this past week economically, I actually think there are more reasons to be bullish than bearish right now if the market is forward-thinking.
Maybe it’s because of St. Patrick’s Day last week and the Irish in me, but I have to say I am still not a full-on bear as I wrote last week, and I am looking for green going into Q2.
SPY technical analysis and other factors:
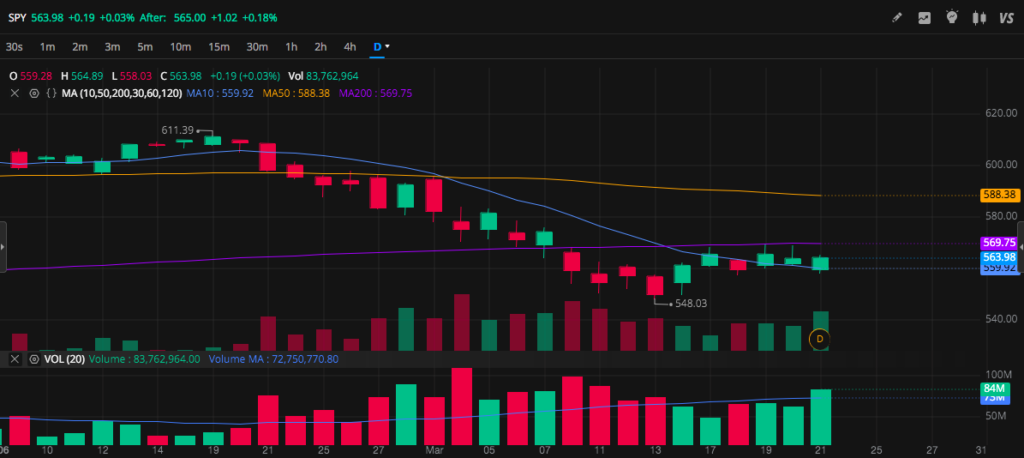
SPY BULLISH:
- Held 10DMA on daily chart
- NVDA held its 10DMA on daily as market leader
- More bullish volume although lower than volume
- Held $557 the last 5 sessions
- Closed above 50DMA on weekly
- Whale trades intraday bullish volume >1M shares traded per minute green bars
- Spinning top green weekly candle
- Has a steady bullish trend from the $549 local bottom
I remain bullish on these notions:
- NVDA holds its 10DMA + passes its 50DMA
- SPY surpasses the 200DMA and holds within the next 2-3 trading sessions + closing ABOVE.
- 10DMA comes up to 200 again
- Bitcoin holding 83K this weekend (or 81k)
- Bitcoin passing and holding 86k
- contrarian trade as market possibly processed tariffs and now trading on posed tariffs going away in future?
I remain bearish on these notions:
- Trump Administration and anything Trump says or does unexpectedly and rash
- More wars breaking out
- SPY breaking $555-550 level
- Bitcoin breaking $83-81k level
- SPY rejecting the 200DMA early again next week and not closing above by Tuesday or mid-week
How I see it:
- Big test next week can SPY break the 200DMA
- Bitcoin in a peculiar position with a fight back above its respective 200DMA to see its 50DMA again (and hold the 10DMA)
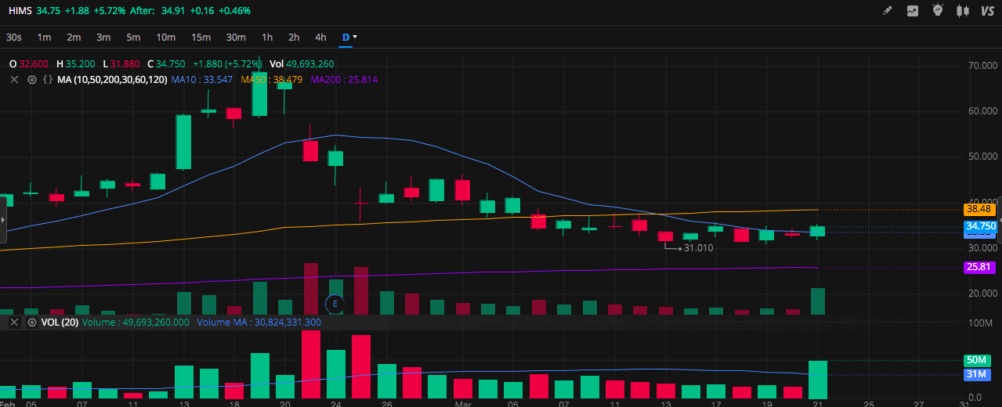
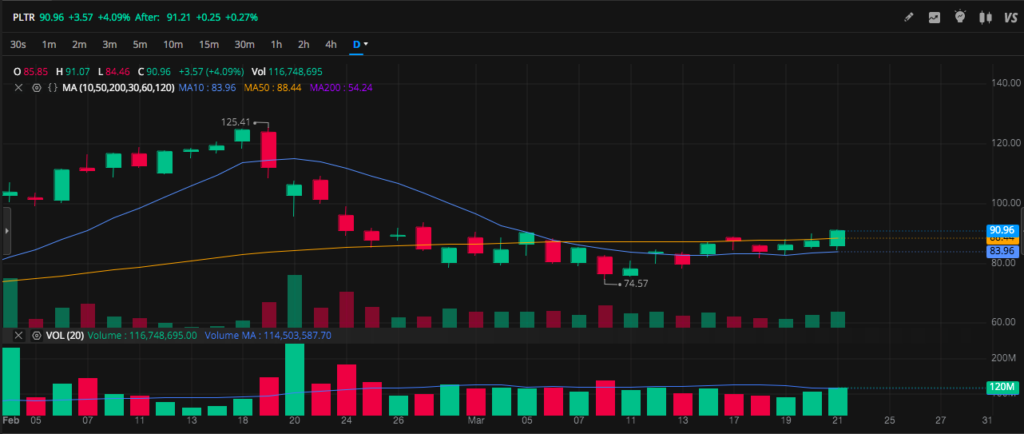
Analyzing Other Popular Stocks
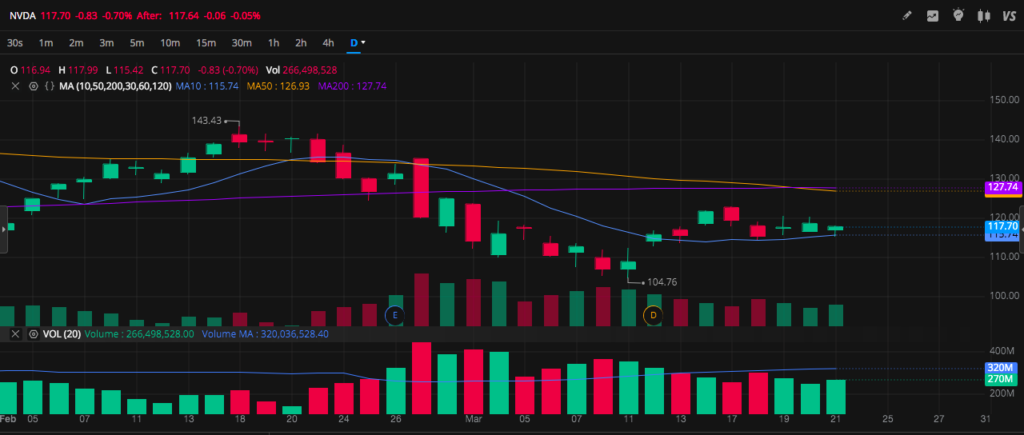
SPY is of course the leader of the pack, but I like to keep an eye on other stocks individually for comparison. Listed below are some popular names along with their 10/50/200 DMA and 3/21 close price (listed in parenthesis). A lot of stocks closed right above their 10DMA on Friday showing signs of a reversal with bullish daily volume; looking closer at NVDA the market leader it did not break my bearish indicator last week, however it also didn’t break my bullish indicator, so who’s to say?
HIMS – 33/38/25 (34.75)
PLTR – 83/88/54 (90.96)
NVDA – 115/126/127 (117.70)
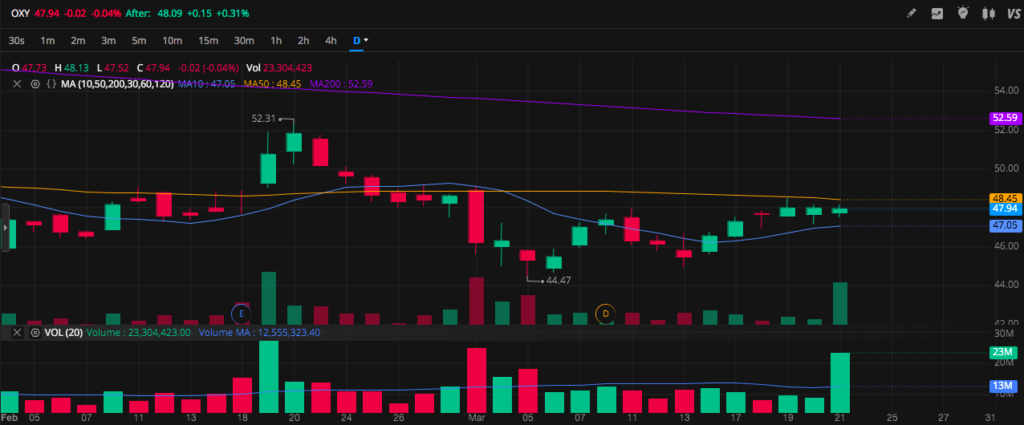
OXY – 47/48/52 (47.94)
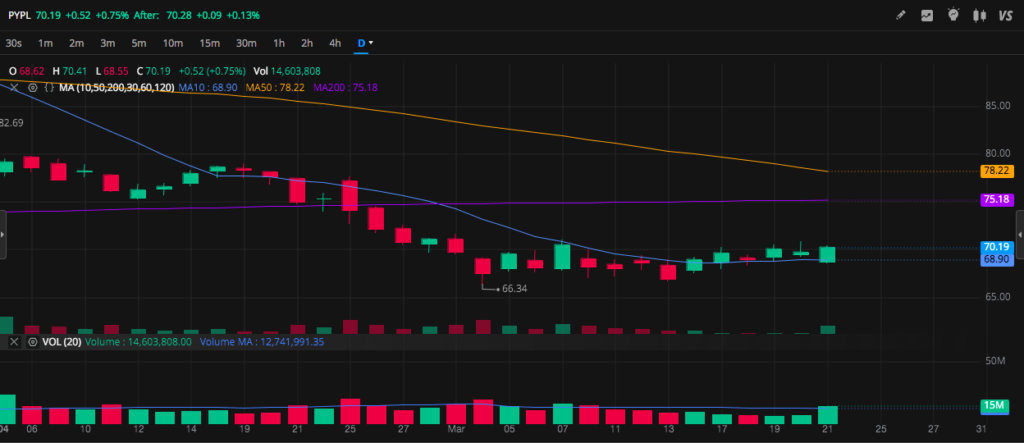
PYPL – 68/78/75 (70.19)
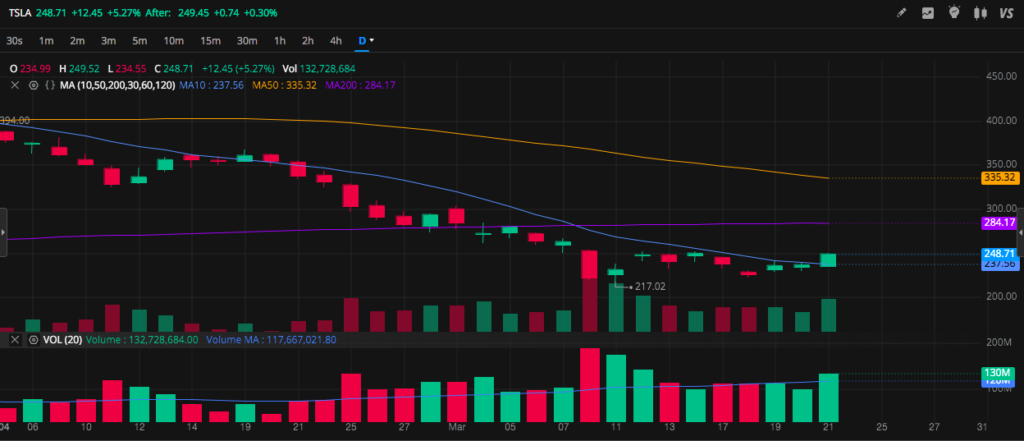
TSLA – 237/335/284 (248.71)
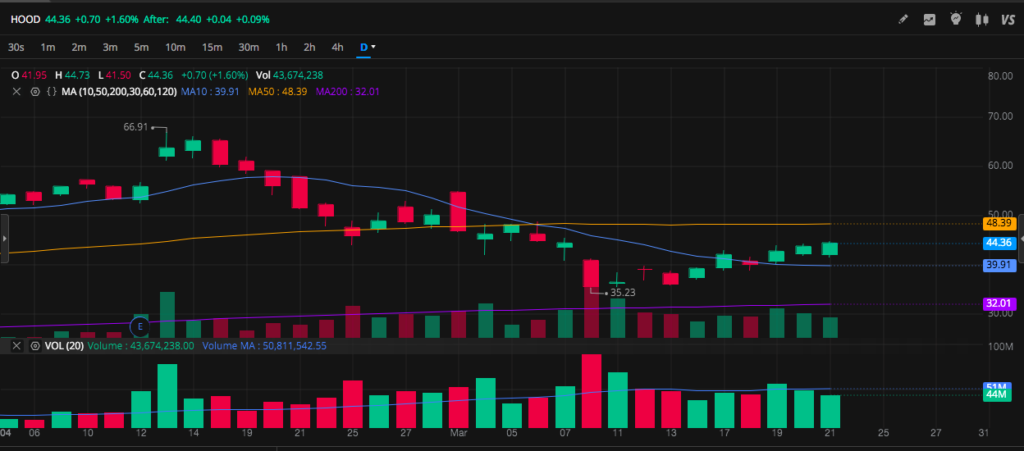
HOOD – 39/48/32 (44.36)
Of course, I have no actual clue what will happen and will likely be embarrassed soon by this post, but I am leaning back bullish. And regardless where the market decides where it wants to go, wishing you all the best with your trades entering the second quarter of 2025.