When it comes to trading SPY, anything can happen. So in the last 60 minutes of a short week when there’s an unusually big move, don’t call it a comeback! This is just business as usual, so it’s important to not let your bias get in the way of missing these gains.
Instead of trying to figure out WHY this happens (does there really need to be a reason?), I’m more interested in figuring out HOW to catch these moves before they happen. Of course, it would take effort and a full-day of concentration, and for most traders on a beautiful gorgeous pre-summer Friday, this is completely out of the question and the beers have already been cracked by 3pm. But for the sniper, they are patiently waiting for these intraday signals, watching volume, carefully planning their scalp–even if it’s holding just for a mere 10 minutes of time.
Last week I gave my view on how I thought we were overdue for a correction down to the 50DMA on the daily chart, and while it was not perfect by any means (ended up bouncing a few points above the 50DMA), overall if you would have added the puts on Tuesday, you would have made over 100% profit on those $527 puts as a hedge if you sold Friday’s low.
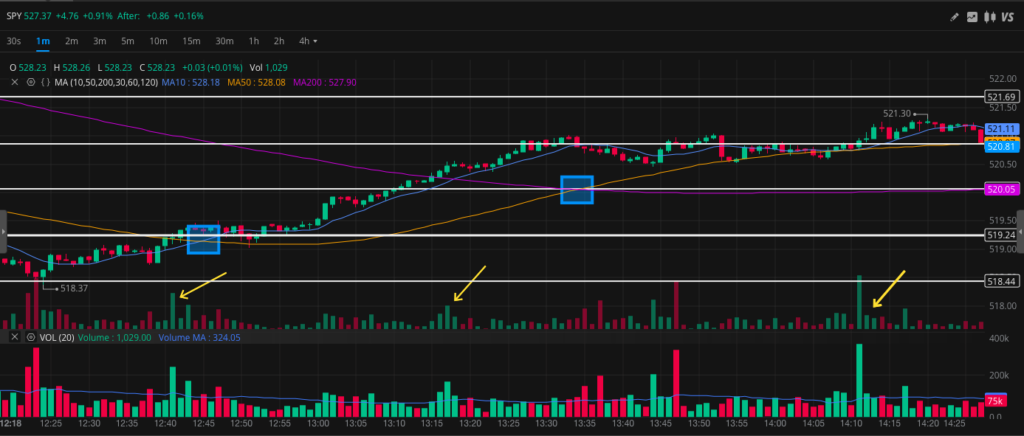
Here is how one might could have made a crazy bullish trade after a bottom of $518 low was found on Friday 5/31 the last hour of the session:

Looking at where support is trying to be found: I drew the white lines here showing the $518 bottom and roughly each one point resistance above between the hours of 12:40-14:30 on the one minute chart. You can see after that large green volume bar around 12:40PM it made a higher low above the intraday bottom support, which was bullish. Once it made $519 support, one could have guessed the daily local bottom was in and added $519-521 calls to sell before the close (or hold and swing into next week, depending on your style).
Finding a green volume bar intraday: most would disagree with me that watching the one minute chart on SPY is absolutely bonkers (fight me!), but when it comes to a vol perspective, in my opinion seeing how many shares are traded in a 1 minute period is invaluable, especially when looking for a reversal signal. As stated above, when that first large volume bar around 12:40 appeared (I drew yellow arrows to the significant bullish vol), and then again at 13:15-13:20 a series of green volume bars to follow, a trader might see that as confirmation that buyers were coming in for this dip. The most bullish signal for the more patient conservative trader might have waited was at 14:11 when about 340k shares roughly were traded at about $520.77 and it ended up running all the way to $527.50 in less than 2 hours (nice!).
Looking for an intraday MA crossover: it’s interesting because right when the first volume bar at 12:41 appeared, a couple minutes later the 10DMA crossed over the 50DMA on the 1 minute chart at 12:45 (blue box). Between 12:45-13:33, SPY had already went from $519-521. Then at 13:34 there was a golden cross aka when the 50DMA crossed over the 200DMA, and SPY proceeded to run even more from $521-528. You guys know I love my MA, and despite those who disagree, I find these to be key in successfully trading SPY.
So while it’s never going to be 100%, having these vol + MA indicators in place helps significantly when deciding to buy on the dip on any timeframe.
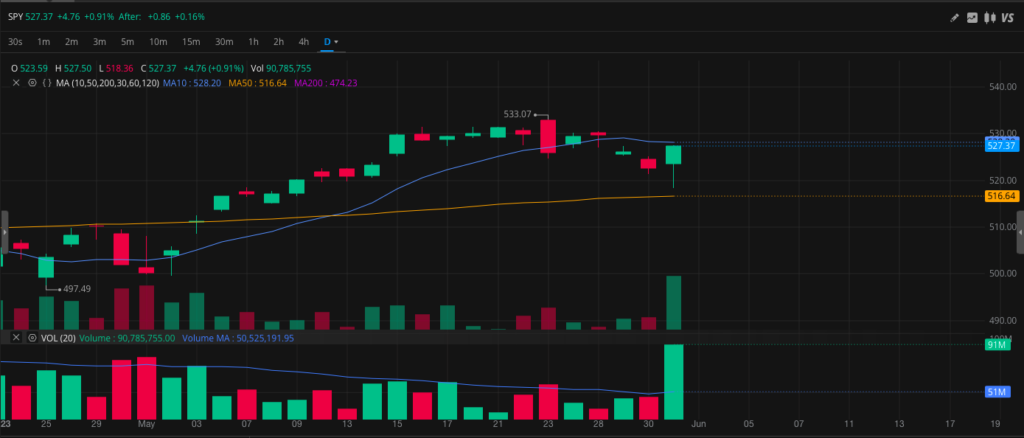
Now for next week, looking at the daily SPY chart since it held above the 50DMA major support, I am now looking for a close above the 10DMA $528.20 on Monday to remain bullish (also: check out that green volume bar from Friday: 91M green vol bar).

For a bounce zone to remain bullish I’d be looking for a minor dip to $523.59, and if it breaks $523 the 50DMA / previous $518 low could be in question again. However I am leaning very bullish based on Friday’s reversal.
So if you missed the big move Friday, I’d be looking at a bullish signal passing $528 and a bearish signal falling below $523. So you could purchase weekly calls $528-530 strike (and who knows, maybe even breaking the previous ATH $533), and $527-523 puts (and maybe even falling below $520 again).
I’m excited for a new month as the last half of May was mostly in the $527-533 range.
